
NOTE: This Management Pack has been updated. Information and download location can be found here.
It happens so that our company needed to know what is going on with our low-end storage devices. We wanted to monitor performance. But this is low-end storage, there is no way to monitor performance. Oh but there is a way…
If you answer all three questions Yes then this MP is for you:
- I am using HP MSA P2000 Storage
- I have SCOM 2007 or 2012
- I want to monitor storage performance
How it Works and what it is capable off
OK first things first. Lets let’s look at the views which Contains logical structure of controllers, ports, vdisks and volumes:
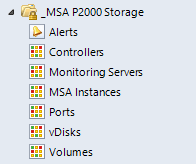
You can view multiple performance counters for controllers, Ports, vDisks and Volumes. There is also option to monitor performance on per physical disk basis but this is turned off by default but Still override is possible.
For example if we want to see Average response time for vDisk we can select vDisk we are interested in and data is displayed as follows:

If you are still interested I can further explain how this MP actually works. There is HP tool which can pool MSA storage. It generates xml files and MP is driven by PS scripts which gather data collected from this xml files.
Basically what you will need is server which will pull data from your MSA storage devices. This server must have SCOM agent installed. I suppose you might be deployed on Management server (MS), but I never tested it on MS so I cannot vouch for that.
OK it is time to get our hands dirty.
How to deploy this MP
- Log on to SCOM Agent Server which will gather XML files
- Under HKLM insert registry key: SOFTWARE\Wow6432Node\Hewlett-Packard\MonitorMSAP2000isInstalled
- WARNING: Modifying REGISTRY settings incorrectly can cause serious problems that may prevent your computer from booting properly. Microsoft cannot guarantee that any problems resulting from the configuring of REGISTRY settings can be solved. Modifications of these settings are at your own risk.Before you modify the registry, make sure to back it up and make sure that you understand how to restore the registry if a problem occurs.
- Preparing Agent to Collect XML Data from SCOM:
- Download HP P2000 MSA Performance Tool from Here
- Copy downloaded files on Server:
libiconv-2_.dll
libxml2-2_.dll
libz_.dll
msacli.exe
- In folder where MSA Tool was installed create XML file with name: get_astat.xml and put following code into it:
<msacommandlist>
<command>show system</command>
<command>show host-port-statistics</command>
<command>show controller-statistics</command>
<command>show vdisk-statistics</command>
<command>show volume-statistics</command>
<command>show disk-statistics</command>
</msacommandlist>
- Create Batch File for each MSA Storage
C:\SCOM_Perf\msacli\msacli.exe” -ip 10.15.16.17 -user monitor -pass pwd -cmdfile “C:\SCOM_Perf\msacli\get_astat.xml” -outdir “C:\perf\MSAfriendlyName1” -format xml:verbose -noConsole -fwVersion false -errFileName staterrormsg.txt
Exit
- Save Batch files under: C:\SCOM_Perf\msacli\CMDScripts Folder
- Prepopulate folders for each MSA Storage. For example if you have three storage systems create folder structure:
C:\perf\MSAfriendlyName1
C:\perf\MSAfriendlyName2
C:\perf\MSAfriendlyName3
- Create Another Batch file which will Call above mentioned Batch file-s with a name: get_HP-P2000_G3.cmd and save it in folder with other scripts. For example:
start C:\SCOM_Perf\msacli\CMDScripts\MSAfriendlyName1.cmd
start C:\SCOM_Perf\msacli\CMDScripts\MSAfriendlyName2.cmd
start C:\SCOM_Perf\msacli\CMDScripts\MSAfriendlyName3.cmd
- Create a Schedule task which will call get_HP-P2000_G3.cmd script every 2 minutes. You can also run this in elevated mode and task will be created:
schtasks /create /tn GET_P2000_SCOM /tr “C:\SCOM_Perf\msacli\CMDScripts\get_HP-P2000_G3.cmd” /sc minute /mo 2 /ru SCH.MSAdataForSCOM /rp SetComplexP@$$word!!!
5. Once script starts to gather XML files we can proceed with standard Management Pack Import.
This is it. After a while data should Visible in SCOM..
Happy SCOMing,
Jure
Still not working? Check these notes:
Note1: You can also create just one Batch script and run it in a Schedule. But we decided to separate them se we do not have to rebuild schedule task each time new MSA Storage arrives.
NOTE2: This is where SCOM will look for data. If folder already exists it should be renamed. Data for each MSA instance must be saved in separate folder under C:\Perf
For Example:
C:\Perf\MSAfriendlyName1
show__controller_statistics.xml
show__disk_statistics.xml
show__host_port_statistics.xml
show__system.xml
show__vdisk_statistics.xml
show__volume_statistics.xml
C:\Perf\MSAfriendlyName2
show__controller_statistics.xml
show__disk_statistics.xml
show__host_port_statistics.xml
show__system.xml
show__vdisk_statistics.xml
show__volume_statistics.xml
NOTE3: If you are having problems you might want to check: if msacli.exe, get_astat.xml and Batch Scripts are correctly called by Task or other CMDs.
Download available from: TechNet Gallery

Hi, thank you so much for starting your new blog and sharing information. This post is really awesome as I got this MP to work in my environment.
Just FYI with some tips for others.
1) HP had taken the download for the HP P2000 MSA Peformance Tool offline but if you search around, others have posted the download links.
2) With the newer firmware of the P2000, the Performance Tool itself will no longer discovers or connect to the array, but the extracted files as mentioned in this post works fine. Also, you can test whether the “monitor” account works by using telnet.
3) With the newer firmware, the P2000 web interface has basic performance graphics built-in. Click the VDisk and then Performance tab.
4) Additionally, HP has its own MP for monitoring the P2000, but it doesn’t include any performance metrics.
Hi,
I am glad I could help.
Thanks for sharing additional info 😉
Jure
Hi jurelab
Great post!
I would like to get the same monitoring done on our P2000’s but HP removed the Performance tool.
Could I convince you to share it with me?
Best regards
Stefan Rathcke Lillemark
Hi Stefan,
No problem, here is link: https://onedrive.live.com/redir?resid=EFEDAF1E0A9CD5DA!107&authkey=!AMzO4fnLy-2QrhE&ithint=folder%2czip
Regards
Jure
Since HP removed Performance tool I updated this post. Now you can download this tool from OneDrive.
Hi,
really appreciate the MSA mp. However, after a week or so it stops working with following warning in event viewer:
Module was unable to convert parameter to a double value
Original parameter: ‘$Data/Property[@Name=’vDiskAvgReadResponseTime’]$’
Parameter after $Data replacement: ”
Error: 0x80020005
Details: Type mismatch.
One or more workflows were affected by this.
Workflow name: Custom.MSA.P2000.Rule.vDiskAvgReadResponseTime
Instance name: vdxyz
Instance ID: {8021BA11-E0DA-50E1-795A-131D91028EE6}
Management group: ABCD
After resarting SCOM services the mp works as expected for another week …
Any ideas how to fix this?
BR,
RMe
Hi,
It seems like MSA Storage returns value which cannot be converted to proper “number format”. I Will investigate and let you know the outcome.
Regards
Jure
Hi,
I have checked it and last time I got this warning in our production environment was 3 months ago. We have around 15 MSAs under monitoring. So this rarely happend in my environment. I will have to create a lab and troubleshoot further from there. But this could take some time. I will let you know once I have more info.
RegardsJ
Thanks, I will wait patiently.
BR, RMe
Pingback: HP MSA P2000 Management Pack – Upgrade | Rather Serious SCOM Blog
Will this work for MSA2012fc storage?
If MSA Performance Tool Will gather data from MSA storage and data is in correct form then it should work. If you have further questions do not hesitate to ask
Regards
Jure
Thanks, will try, just one more question – could you explain further where do i have to add the registry key?
Ignore my last message, thought for 5mins and got it, but i got a different question now.
Installing perf tool… msacli.exe is the installation file? because when i open it it just open a batch file and closes it instantly, nothing further happens
You have to add a few switches: C:\SCOM_Perf\msacli\msacli.exe” -ip 10.15.16.17 -user monitor -pass pwd -cmdfile… => See details in post.
In order for MP to work you have to create batch files and then scheduled task to run it so XML files with MSA storage data are refreshed
Regards
Jure
I Think i’ve done everything correcly but when i try to run the script i get error that libxml2-2_.dll is missing, but it is not missing, it’s right there in the folder with msacli.exe… why is this happening?
Sorry for spamming your blog 🙂 sad that i can’t delete my previous message, i manage to get it working but only stateerrormsg.txt apears with:
04/22/2015-11:12:40::show host-port-statistics->::show controller-statistics->::show vdisk-statistics->::show volume-statistics->::show disk-statistics->
Did you precreate XML file get_astat.xml in folder => “C:\SCOM_Perf\msacli\?
yes I did and when i only leave Show_system in it everything runs fine, and Show__System.xml appears on my folder, nothing appears on SCOM tho
I fixed my issue, typo in the registry key. Once i corrected that, all started appear within 10 minutes.
One question though, i can see all points about the storage but how do i view a graph on performance of the disks over time? like 24 hours or 48 hours?
Our san is been overloaded, but we cant buy a new one until i prove the disks are slow! even though we know there slow! I need a graph to show them based on usage over 24/48 hours before they buy a new one! 🙂
I would create a performace view of vDisks and check its Avg Response time with selected time range of 2 days.
Yes I did that. That shows up ok but can’t find the objects for a dashboard view. The only that shows up is the hp one view storage objects which tell me the health of the units. The one view management packs don’t bring forward iops and average wait time …well that I can see anyway
I created New Performance View and selected vDisk for Object..